More mapping “not quite how-to” - Voronoi regions
What this post is about
In the previous post we showed how to set up a simple interactive map using Python and its folium package. As the example, we used a Federal electorate situated within the city of Melbourne, Australia, and the various voting places, or polling places (also known as polling “booths”) associated with it.
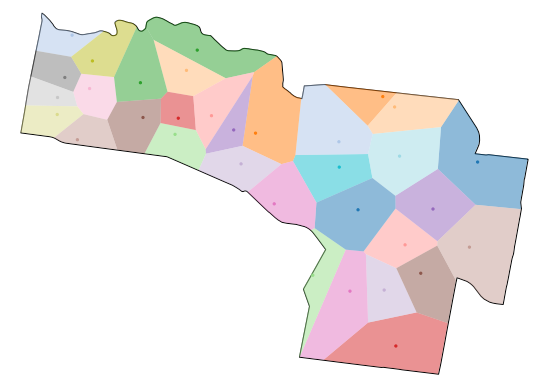
This post takes the map a little further, and we show how to use Python’s geovoronoi package to create Voronoi regions around each booth. This (we hope) will give a map of where voting for a particular party might be strongest. (We make the assumption that every voter will vote at the booth closest to their home.)
Because some voting booths are outside the electorate - this includes early voting centres - we first need to reduce the booths to only those withing the boundary of the electorate. In this case, as the boundary is a simply-connect region, this is straightforward. The we can create the Voronoi regions and map them.
Message about the underlying software
Leaflet version 1.80 was released on April 18, “in the middle of war”, with “air raid sirens sounding outside”. See the full statement here.

(This banner is included here with the kind permission of Mr Agafonkin.) Please consider the Ukrainian people who are suffering under an unjust aggressor, and help them.
Obtaining interior points and Voronoi regions
We start by simplifying a few of the variable names:
hbooths = higgins_booths.copy()
We will also need the boundary of the electorate:
higgins_crs=higgins.to_crs(epsg=4326)
higgins_poly = higgins_crs["geometry"].iat[0]
Now finding the interior points is easy(ish) using GeoPandas:
higgins_gpd = gpd.GeoDataFrame(
    hbooths, geometry=gpd.points_from_xy(hbooths.Longitude, hbooths.Latitude))
higgins_crs = higgins_gpd.set_crs(epsg=4326)

interior = higgins_crs[higgins_crs.geometry.within(higgins_poly)].reset_index(drop=True)
We should also check if any of the interior points double up. This might be if one location is used say, for both an early voting centre, and a voting booth on election day. The geovoronoi package will throw an error if a location is repeated.
ig = interior.groupby(["Latitude","Longitude"]).size()
ig.loc[ig.values>1]

Latitude    Longitude
-37.846104  144.998383    2
dtype: int64
The geographical coordinates can be obtained with, say
double = ig.loc[ig.values>1].index[0]
This means we can find the offending booths in the interior:
interior.loc[(interior["Latitude"]==double[0]) & (interior["Longitude"]==double[1])]
| PollingPlaceNm | Latitude | Longitude | geometry | |
|---|---|---|---|---|
| 28 | South Yarra HIGGINS PPVC | -37.846104 | 144.998383 | POINT (144.99838 -37.84610) |
| 29 | South Yarra South | -37.846104 | 144.998383 | POINT (144.99838 -37.84610) |
We’ll remove the pre-polling voting centre at row 28:
interior = interior.drop(28)
Now we’re in a position to create the Voronoi regions. We have the external polygon (he boundary of the electorate), and all the internal points we need, with no duplications.
from geovoronoi import voronoi_regions_from_coords, points_to_region

interior_coords = np.array(interior[["Longitude","Latitude"]])
polys, pts = voronoi_regions_from_coords(interior_coords, higgins_poly))
Each of the variables polys and pts are given as dictionaries. We want to
associate each interior voting booth with a given region. This can be done by
creating an index between the points and regions, and then adding the regions to
the interior dataframe:
index = points_to_region(pts)

N = len(polys)
geometries = [polys[index[k]] for k in range(N)]
interior["geometry"]=geometries
What this has done is replace the original geometry data (which were just the
coordinates of each voting booth, given as “POINT” datatypes), to regions
given as “POLYGON” datatypes.
Adding some voting data
We could simply map the Voronoi regions now:
from geovoronoi.plotting import subplot_for_map, plot_voronoi_polys_with_points_in_area

fig, ax = subplot_for_map(figsize=(10,10))
plot_voronoi_polys_with_points_in_area(ax, higgins_poly, polys, interior_coords, pts)
plt.savefig('higgins_voronoi.png')
plt.show()
But what we want is a little more control. But first, we’ll add some more information to the DataFrame. The simplest information is the “two candidate preferred” data: these are the number of votes allocated to the two final candidates after the preferential counting. The files are available on the AEC website; they can be downloaded and used:
tcp = pd.read_csv('HouseTcpByCandidateByPollingPlaceDownload-27966_2.csv')
higgins_tcp = tcp.loc[tcp["DivisionNm"]=="Higgins"]
Each candidate gets their own row, which means we have to copy the cotes from
each candidate into the interior DataFrame. In the case of the 2022 election,
the Higgins final candidates represented the Australian Labor Party (ALP), and the
Liberal Party (LP). The party is given in the column “PartyAb” in the
higgins_tcp data frame. Adding them to the interior data frame is only a tiny
bit fiddly:
lp_votes = []
alp_votes = []
for index,row in interior.iterrows():
    place = row["PollingPlaceNm"]
    alp_votes += [higgins_tcp.loc[(higgins_tcp["PollingPlace"]==place) & (higgins_tcp["PartyAb"]=="ALP"),"OrdinaryVotes"].iat[0]]
    lp_votes += [higgins_tcp.loc[(higgins_tcp["PollingPlace"]==place) & (higgins_tcp["PartyAb"]=="LP"),"OrdinaryVotes"].iat[0]]
interior["ALP Votes"] = alp_votes
interior["LP Votes"] = lp_votes
Creating the map
The base map is the same as before:
hmap2 = folium.Map(location=centre,# crs='EPSG4283', tiles='OpenStreetMap',
                 min_lat=b1-extent, max_lat=b3+extent,
                 min_long=b0-extent, max_long=b2+extent,
               width=800,height=800,zoom_start=13,scrollWheelZoom=False)
We don’t need to draw the boundary or interior as the Voronoi regions will cover it. What we’ll do instead is draw each Voronoi region, colouring it red (for a Labor majority) or blue (for a Liberal majority). Like this:
for index,row in interior.iterrows():
    rloc = [row["Latitude"],row["Longitude"]]
    row_json = gpd.GeoSeries([row["geometry"]]).to_json()
    tooltip = ("<b>{s1}</b>").format(s1 = row["PollingPlaceNm"])
    if row["ALP Votes"] > row["LP Votes"]:
        folium.GeoJson(data=row_json,style_function=lambda x: {'fillColor': 'red'}).add_to(hmap2)
        folium.CircleMarker(radius=5,color="black",fill=True,location=rloc,tooltip=tooltip).add_to(hmap2)
    else:
        folium.GeoJson(data=row_json,style_function=lambda x: {'fillColor': 'blue'}).add_to(hmap2)
        folium.CircleMarker(radius=5,color="black",fill=True,location=rloc,tooltip=tooltip).add_to(hmap2)
And to view the map:
hmap2