A mapping “not quite how-to”
Message about the underlying software
Leaflet version 1.80 was released on April 18, “in the middle of war”, with “air raid sirens sounding outside”. See the full statement here.

(This banner is included here with the kind permission of Mr Agafonkin.) Please consider the Ukrainian people who are suffering under an unjust aggressor, and help them.
The software libraries and data we need
The idea of this post is to give a little insight into how my maps were made. All software is of course open-source, and all data is freely available.
The language used is Python, along with the libraries:
- Pandas for data manipulation and analysis
- GeoPandas which adds geospatial capabilities to Pandas
- folium for map creation - this is basically a Python front-end to creating interactive maps with the powerful leaflet.js JavaScript library.
- geovoronoi for adding Voronoi diagrams to maps
Other standard libraries such as numpy and matplotlib are also used.
The standard mapping element is a shapefile which encodes a map element: for example the shape of a country or state; the position of a city. In order to use them, they have to be downloaded from somewhere. For Australian Federal elections, the AEC makes available much relevant geospatial information.
Victorian geospatial information can be obtained from Vicmap Admin.
Coordinates of polling booths can be obtained again from the AEC for each election. For the recent 2022 election, data is available at their Tallyroom. You’ll see that this page contains geospatial data as well as election results. Polling booth locations, using latitude and longitude, are available here.
Building a basic map
We can download the shapefiles and polling booth information (unzip any zip files to extract the documents as needed), and read them into Python:
vic = gpd.read_file("E_VIC21_region.shp")
booths = pd.read_csv("GeneralPollingPlacesDownload-27966.csv")
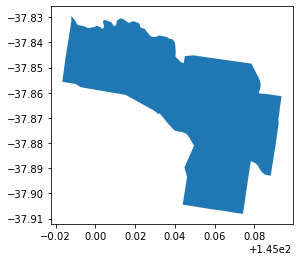
Any Division in Victoria can be obtained and quickly plotted; for example Higgins:
higgins = vic.loc[vic["Elect_div"]=="Higgins']
higgins.plot()
We can also get a list of the Polling Places in the electorate, including their locations:
higgins_booths = booths.loc[booths["DivisionNm"]=="Higgins"][["PollingPlaceNm","Latitude","Longitude"]]
With this shape, we can create an interactive map, showing for example the names of each polling booth.
To plot the electorate on a background map we need to first turn the shapefile into a GeoJSON file:
higgins_json = folium.GeoJson(data = higgins.to_json())
And to plot it, we can find its bounds (in latitude and longitude) and place it in a map made just a little bigger:
b0,b1,b2,b3 = higgins.total_bounds
extent = 0.1
centre = [(b1+b3)/2,(b0+b2)/2]

hmap = folium.Map(location=centre,
                  min_lat=b1-extent,
                  max_lat=b3+extent,
                  min_long=b0-extent,
                  max_long=b2+extent,
                  width=800,height=800,
                  zoom_start=13,
                  scrollWheelZoom=False
                  )
higgins_json.add_to(hmap)
hmap
The various commands and parameters above should be straightforward: from the
latitude and longitude given as bounds, the variable centre is exactly that.
Because our area is relatively small, we can treat the earth’s surface as
effectively flat, and treat geographical coordinates as though they were
Cartesian coordinates. Thus for this simple map we don’t have to worry about
map projections. The defaults will work fine. The variables min_lat and the
others define the extent of our map; width and height are given in pixels; and an
initial zoom factor is given. The final setting ``scrollWheelZoom=False`` stops
the map from being inadvertently zoomed in or out by the mouse scrolling on it
(very easy to do). The map can be zoomed by the controls in the upper left:
We can color the electorate by adding a style to the JSON variable:
higgins_json = folium.GeoJson(data = higgins.to_json(),
                               style_function = lambda feature: {
                                   'color': 'green',
                                   'weight':6,
                                   'fillColor' : 'yellow',
                                   'fill': True,
                                   'fill_opacity': 0.4}
                              )
Because folium is a front end to the Javascript leaflet.js package, much information is available on that site. For instance, all the parameters available to change the colors, border etc of the electorate are listed in the description of the leaflet Path.
Adding interactivity
So far the map is pretty static; we can zoom in and out, but that’s about it. Let’s add the voting booths as circles, each one with with a “tooltip” giving its name. A tooltip is like a popup which automatically appears when the cursor hovers over the relevant marker on the map. A popup, on the other hand, requires a mouse click to be seen.
We can create the points and tooltips from the list of booths in Higgins.
for index, row in higgins_booths.iterrows():
    loc = [row["Latitude"],row["Longitude"]]
    tooltip = ("<b>{s1}</b>").format(s1 = row["PollingPlaceNm"])
    folium.CircleMarker(radius=5,color="black",fill=True,location=loc,tooltip=tooltip).add_to(hmap)
The map can now be saved:
hmap.save("higgins_booths.html")
and viewed in a web browser:
This a very simple example of an interactive map. We can do lots more: display markers as large circles with numbers in them; divide the map into regions and make the regions respond to hovering or selection, add all sorts of text (even html iframes) as popups or tooltips, and so on.