Poles of inaccessibility
Just recently there was a news item about a solo explorer being the first Australian to reach the Antarctic "Pole of Inaccessibility". Such a Pole is usually defined as that place on a continent that is furthest from the sea. The South Pole is about 1300km from the nearest open sea, and can be reached by specially fitted aircraft, or by tractors and sleds along the 1600km "South Pole Highway" from McMurdo Base. However, it is only about 500km from the nearest coast line on the Ross Ice Shelf. McMurdo Base is situated on the outside of the Ross Ice Shelf, so that it is accessible from the sea.
The Southern Pole of Inaccessibility is about 870km further inland from the South Pole, and is very hard to reach---indeed the first people there were a Russian party in 1958, whose enduring legacy is a bust of Lenin at that Pole. Unlike at the South Pole, there is no base or habitation there; just a frigid wilderness. The Southern Pole of Inaccessibility is 1300km from the nearest coast.
A pole of inaccessibility on any landmass can be defined as the centre of the largest circle that can be drawn entirely within it. You can see all of these for the world's continents at an ArcGIS site. If you don't want to wait for the images to load, here is Antarctica:
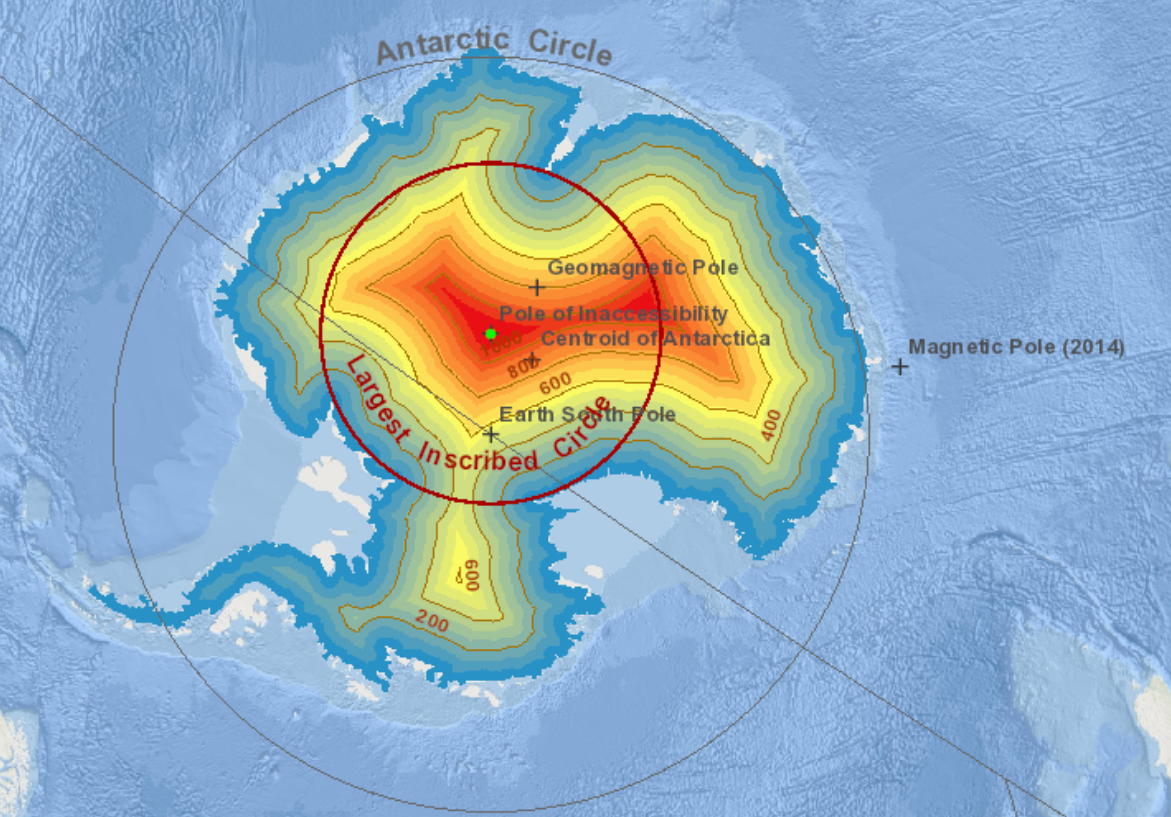
You'll notice that this map of Antarctica is missing the ice shelves, which fill up most of the bays. If the ice shelves are included, then we can draw a larger circle.
As an image processing exercise, I decided to experiment, using the distance transform to measure distances from the coasts, and Julia as the language. Although Julia has now been in development for a decade, it's still a "new kid on the block". But some of its libraries (known as "packages") are remarkably mature and robust. One such is its imaging package Images.
In fact, we need to install and use several packages as well as Images: Colors,
FileIO, ImageView, Plots. These can all be added with Pkg.add("packagename") and brought
into the namespace with using packagename. We also need an image to use, and
for Antarctica I chose this very nice map of the ice surface:
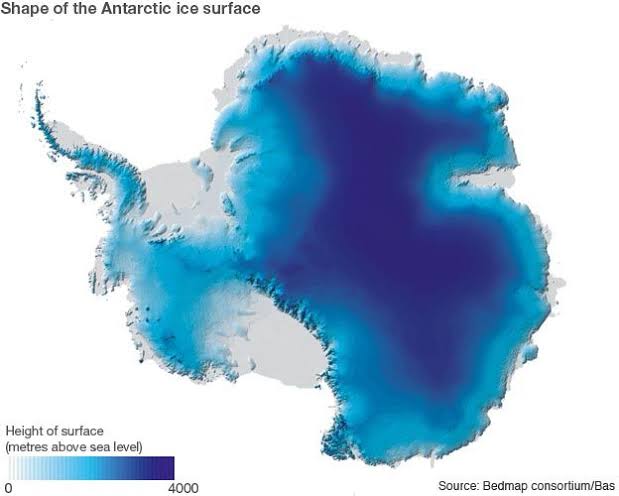
taken from a BBC report. The nice thing about this map is that it shows the ice shelves, so that we can experiment with and without them. We start by reading the image, making it gray-scale, and thresholding it so as to remove the ice-shelves:
julia> ant = load("antarctica.jpg");
julia> G = Gray.(ant);
julia> B = G .> 0.8;
julia> imshow(B)
which produces this:
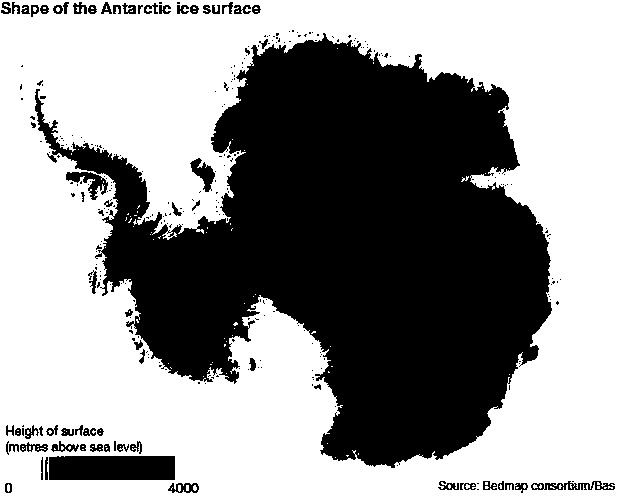
which as you see has removed the ice shelves. Now we apply the distance transform and find its maximum:
julia> D = distance_transform(feature_transform(B));
julia> findmax(D)
(116.48175822848829, CartesianIndex(214, 350))
This indicates that the largest distance from all edges is about 116, at pixel location (214,350). To show this circle on the image it's easiest to simply plot the image, and then plot the circle on top of it. We'll also plot the centre, as a smaller circle:
julia> plot(ant,aspect_ratio = 1)
julia> x(t) = 214 + 116*cos(t)
julia> x(t) = 350 + 116*sin(t)
julia> xc(t) = 214 + 5*cos(t)
julia> xc(t) = 350 + 5*sin(t)
julia> plot!(y,x,0,2*pi,lw=3,lc="red",leg=false)
julia> plot!(yc,xc,0,2*pi,lw=2,lc="white",leg=false)
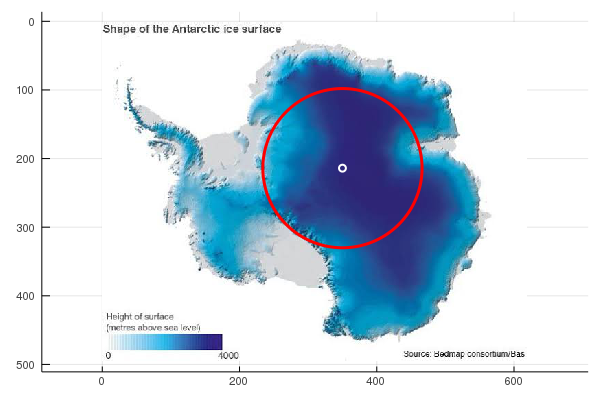
This shows the Pole of Inaccessibility in terms of the actual Antarctic continent. However, in practical terms the ice shelves, even though not actually part of the landmass, need to be traversed just the same. To include the ice shelves, we just threshold at a higher value:
julia> B1 = opening(G .> 0.95);
julia> D1 = distance_transform(feature_transform(B1));
julia> findmax(D1)
(160.22796260328596, CartesianIndex(225, 351))
The use of opening in the first line is to fill in any holes in the image: the
distance transform is very sensitive to holes. Then we plot the continent again
with the two circles as above, but using this new centre and radius. This
produces:
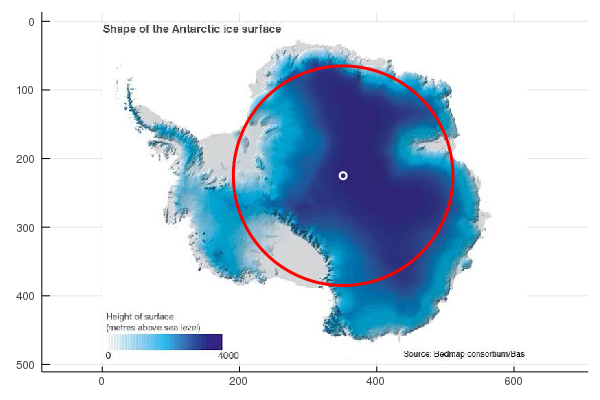
The position of the Pole of Inaccessibility has not in fact changed all that much from the first one.